Procedure for building power plants in Turkey

10:11 AM Reporter: Baris Sanli 0 Responses

Sometimes, people ask me about the complete procedure for building and licensing power plant projects in Turkey. So far, the best resource has been the Turkish State Owned Electricity Company EÜAŞ's diagrams.
Check these websites from www.euas.gov.tr :

Construction of new thermal power plant by private sector

Construction of new hydro power plant by private sector


Read more...

What if a barrel of oil is paid by gold instead of dollars?

11:31 AM Reporter: Baris Sanli 0 Responses

As the trust towards paper money decreased, I am wondering whether the oil is priced with gold... After checking several statistics, there is a Beta distribution of Gold price/WTI price ratio.
So far 15-17 is a ratio between gold and wti. Therefore in the following month (August,2011), numbers point to oil prices of 110$ (WTI), and 130$ Brent.

Note on 5 August 2011: I expected the panic to start by end of August. However seems like it has been already started.. So the recent panic has broken the relation. Gold is on the rise, oil is down..... This is a typical ringing bell of a recession... Next time I should state "ceteris paribus":)
One thing to watch is the base price level of oil...
www.barissanli.com

Read more...

Time for getting permissions for wind turbines and number of authorities consulted

9:58 AM Reporter: Baris Sanli 0 Responses
Last week an investor told me some interesting numbers regarding wind energy consent times and number of authorities liaise with. So I decided to make my own research:
Read this
The Wind Barriers project also investigated the number of authorities that need to be contacted in each country in order to obtain permission to build onshore. Denmark has the fewest authorities to contact, just five, whereas Greece has the most authorities to contact, with 41. But there is not a direct correlation between the length of time it takes to get permission and the number of authorities that need to be contacted.
The experience in the offshore sector is, so far, more positive. The average time to get the green light is 18 months, much lower than onshore. “A number of countries with offshore wind farms have developed an efficient decision making process for this sector, thereby reducing the complexity for offshore wind developers,” concluded Wilkes.


Ref:http://www.ewea.org/index.php?id=60&no_cache=1&tx_ttnews%5Btt_news%5D=1834&tx_ttnews%5BbackPid%5D

Read more...

Effect of Carbon Prices on Turkish Electricity Prices

4:06 PM Reporter: Baris Sanli 0 Responses

Recently I have completed a study on the effect of Carbon prices on Turkish electricity prices. Here is my result (Electricity supply curve MW vs $cent/kWh)

Read more...

IEA's 60 million barrels and US's SPR

5:25 PM Reporter: Baris Sanli 0 Responses
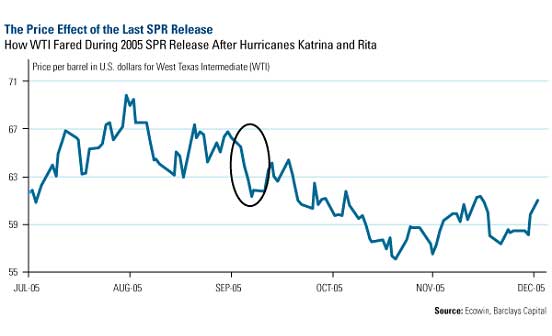
Previous SPR's effect (During Katrina)

On the 23rd June 2011, IEA has decided to release 60million barrels from its 28 members' reserves.
IEA members have 4.1 billion barrels of stocks, some 1.4 billion barrels is for emergency.
They will release 2 million barrels/day for the initial 30 days.

The question is whether this reserves can be traded freely like a normal reserve? Buyers of SPR may not sell it to overseas (Platts)
  • "The auction for 30 million barrels of light sweet crude starts at 1 p.m. CDT on Wednesday, with deliveries occurring between August 1-31."
  • ""No, you cannot sell to Latin America or China," DOE said in an explainer posted to its website. "SPR petroleum may be exported only with an export license and in connection with the return of refined products to the US.""
  • "The US share [30 million barrels] represents 4% of its current stockpile of 727 million barrels"
  • U.S. holds (56 percent) while Japan (24 percent), Europe (14 percent) and Korea (6 percent) of the SPRs.(321 energy)


Ref:
http://www.iea.org/press/pressdetail.asp?PRESS_REL_ID=418
http://www.platts.com/RSSFeedDetailedNews/RSSFeed/Oil/6229240
http://321energy.com/editorials/holmes/holmes0062811.html

Read more...

India and Coal Power Plant Crises

5:19 PM Reporter: Baris Sanli 0 Responses
Platts has this news item with lots of useful numbers:
In India
  • 80000 MW of coal plants under construction
  • Target of adding 100000 MW in the next 5 years
  • Environmental problems for local coal prevented 203 mines that can fuel 130000 MW
  • Coal India produces 80% of national production


Reference
Platts, http://www.platts.com/NewsFeature/2011/CoalFired/index

Read more...

The cost of oil production capacity

5:19 PM Reporter: Baris Sanli 0 Responses
Manouchehr Takin from Center for Global Energy Studies has a brief summary of oil production capacity costs here.
Here is a summary. Remember that the units is per peak daily barrel. That is if you want to build a 100.000 barrels per day peak capacity for Haradh III, you have to invest $2,500*100.000 = 250 million dollars at least."

Saudi Arabia
- $2,500 (per peak daily barrel) for development of the Haradh III zone of the supergiant Ghawar oilfield
- $10,000 for the massive Khurais et al development a
- $17,500 for the Manifa field

-$40,000 heavy oil projects of Iran
-$85,000 supergiant Kashagan field in Kazakhstan

"

Ref:
The cost of Saudi Arabia’s oil production capacity, Manouchehr Takin, http://www.cges.co.uk/resources/articles/2011/06/21/the-cost-of-saudi-arabia%E2%80%99s-oil-production-capacity

Read more...

Ernst&Young's Renewable Energy Attractiveness Index

11:41 AM Reporter: Baris Sanli 0 Responses
Ernst&Young has an interesting indice that you can find from here:
http://www.ey.com/GL/en/Industries/Power---Utilities/Renewable-energy-country-attractiveness-indices
The report also includes one page review of some countries including China, UK, Poland and Chile.

Country Attractiveness Indices:
http://www.ey.com/GL/en/Industries/Oil---Gas/Oil_Gas_Renewable_Energy_Attractiveness-Indices

Recent Index
http://www.ey.com/GL/en/Industries/Power---Utilities/Renewable-energy-country-attractiveness-indices

Read more...

A few explanations for the sudden fall of oil prices

4:53 PM Reporter: Baris Sanli 0 Responses
There are several explanations but let me summarize that
1. The realization of profits from commodity rush
2. Euro's fall, dollar's rise (read econbrowser link at the end)
3. Inventory levels
4. Demand Destruction
But to have a broader understanding, here is a bunch of explanations from FT (stated from some other source):

-”disappointing global economic headlines” (Platts), referring specifically to an unexpected fall in German industrial orders and the strongest rise in US unemployment since August 2010

-OPEC’s consideration to raise formal quota levels in June

-the death of Osama bin Laden and falling geopolitical risks amid “stabilising tensions” in the Middle East and the end of Nigerian elections

-the end of QE2 in June

-interest rate hikes in India and other Asian countries

-the rise of the dollar amid ECB indications of no imminent further interest rate hike

-the impact of higher fuel and commodity costs

-the general sell-off in commodities, with silver losing 25% of its value since April 25

-George Soros cutting his gold holdings

-a larger-than-expected build in US crude inventories

-a fall by 1.3 million b/d to 18.3 million b/d in US weekly implied demand figures

Ref:
http://blogs.ft.com/energy-source/2011/05/06/explanations-for-the-oil-crash/
http://www.econbrowser.com/archives/2011/05/lower_oil_price.html

Read more...

Seasonal variations in oil prices

5:21 PM Reporter: Baris Sanli 0 Responses
From 321energy.com web site, Frank Holmes has this nice graph, which should be in the collection. The graph shows the seasonal changes in oil prices with 28, 15 and 5 year patterns. It is interesting to see these variations in terms of different time spans.

References
Why high oil prices are likely here to stay?, http://321energy.com/editorials/holmes/holmes041311.html


Read more...

Environmentalists have no one to blame but themselves for failing to sell their climate policies

4:53 PM Reporter: Baris Sanli 0 Responses
After all the climate change discussions, TNR has a review of a report and ideas about why climate change may have failed to achieve the desired goals. Although the game is not over yet, the favourable atmosphere for climate change is not that favourable any more.
At one instance, the writer says:
"Mike Hulme, a climate scientist at the University of East Anglia, has argued that greens mistakenly treated global warming as a run-of-the-mill environmental problem similar to, say, acid rain. But, with acid rain, feasible solutions were already available—namely, scrubbers and low-sulfur coal—that made it relatively straightforward to cap sulfur-dioxide emissions. "
I think this is a key sentence from my viewpoint

References:


Read more...

Oil Prices, Macroeconomics and Shocks...

4:23 PM Reporter: Baris Sanli 0 Responses
There are very good articles on oil prices and macroeconomics. "The oil price and macroeconomy: what's going on?" by Olivier Blanchard and Marianna Riggi claims that the changes in labor markets and monetary policies("structural changes") can be the usual suspects when it comes to resilient economies to oil price hikes. They have two conclusions:
1. "weakening unions, increasing competition and declining minimum wage have made the structure of labor compensation much more flexible in the 2000s than it was in the 1970s"
2. "increased anchoring of inflation expectations, and in particular with the decrease in the response of expected inflation to an oil price surge since the mid-1980s"
There is also "Why are the 2000s so different from the 1970s? A structural interpretation of changes in the macroeconomic effects of oil prices" , from the same writers is also giving the details for such conclusions.

Also, "Some thoughts on Energy independence" from EconBrowser has a good discussion for demand side and supply side effects of oil prices. He concludes : "increasing the substitutability between energy and other consumption goods, and reducing the amount of oil use would mitigate the negative consequences of oil price shocks."

ei2.gif

References:
The oil price and macroeconomy: what's going on?, by Olivier Blanchard and Marianna Riggi http://www.voxeu.org/index.php?q=node/4341
Why are the 2000s so different from the 1970s? A structural interpretation of changes in the macroeconomic effects of oil prices" , http://www.nber.org/papers/w15467
Some thoughts on Energy independence, http://www.econbrowser.com/archives/2011/04/some_thoughts_o_2.html

Read more...

Measuring Energy Security

12:15 PM Reporter: Baris Sanli 0 Responses
"Measuring Energy Security: Trends in the diversification of oil and natural gas supplies" by Gail Cohen, Frederick Joutz and Prakash Loungani is an interesting paper to read. They took several indices (supply, imports, political risks, size of importer countries and distance between capitals ) to measure energy security for natural gas and oil

What is interesting was the trend for oil in the computed index(there is a decrease till 1999 and a rebound in 2003.) Also keep in mind:
"For about two-thirds of the countries, there has been a decrease in CSI values – an
increase in measured energy security – between 2000 and 2008. [...] For quite a few countries, the decrease comes about not so much because of mere diversification in the sources of energy supplies but because of the lower political risk associated with some of their suppliers.", p14
My critique: "it is not just the fuel per se, but the importance of fuel in the main consuming sector and the critical level of this fuel for this sector. See for example transportation and its dependence on oil,

Reference:
http://www.imf.org/external/pubs/ft/wp/2011/wp1139.pdf


Read more...

Turkey's Use Tables - The effect of Energy Inputs on Industries

10:48 AM Reporter: Baris Sanli 0 Responses
While reading this piece from IAEE blog, it occured to me that one needs to have an understanding of the broader affects of energy price increases. So I checked the tables from 2002 from TurkStat's web page.
The graph represents the percentage of energy products used in the sectoral output(without value added). As the most energy intensive industries locate at the top, where energy inelastic industries position at the bottom.
Remember this table is from 2002
And the results can be downloaded from here:

https://docs.google.com/leaf?id=0B_ar4GSVZ_k5ODhiMzYyNTEtZWNhOS00Zjc2LWExY2QtNGRjOGE2YzdlMTRh&hl=tr

Read more...

The effects of Japanese Tsunami and Nuclear Problem

3:02 PM Reporter: Baris Sanli 0 Responses

Demand Side:
1.
“At least five Japanese-owned refineris with total capacity 1.5 million b/d (1/3rd of Japanese capacity is shutdown)” (Ref:1)
2. “Some 9.7 Gw of nuclear power generation—30% of Japan’s total nuclear power capacity and 7% of Japan’s total power generation capacity—were shut down” (Ref:1)
3. 9.7 GW= 9.7*8.000=77.6 TWh of nuclear energy should be substituted by natural gas and coal. Assuming 50% of this lost capacity to be substituted by LNG = 38.8 TWh. That much of electricity can be obtained by at least 7.09 bcm of LNG (Sources claim as much as 10 bcm)
4. Estimated additional demand of coal can be 5m-30m tonnes (Ref:2)

International Markets:
1.
Natural gas prices : up 7.7% (Ref:2)
2. Oil : down 1.94% (Ref:2)
3. Coal: By April 1, previous record of $125/ton (Australia) may be topped. (Ref:2)

European Nuclear Firms:
-
European energy firms like EON(-8.52%) , RWE (-%7.95), EDF (-11%) (Ref:3)
- Also check mining firms from here : Ref:3
- "German Chancellor Angela Merkel said on Tuesday that all seven of the country’s nuclear power plants which began operation before 1980 would be provisionally shut down." (Ref:5)


Finance:
- There is probably more uninsured damage in the destruction of North East Japan than in any other event in history – and uninsured damage falls sharply on banks. (Ref:4)

Ref:1
http://www.cges.co.uk/media/articles/2011/03/15/japan-quake-scrambles-market
Ref:2 http://blogs.ft.com/energy-source/2011/03/14/energy-market-disruption-in-figures/
Ref:3 http://ftalphaville.ft.com/blog/2011/03/15/514546/euro-nuclear-paralysed-and-paralysing/?utm_source=twitterfeed&utm_medium=twitter
Ref:4 http://ftalphaville.ft.com/blog/2011/03/14/513446/super-catastrophe-and-super-banking-risk
Ref:5 http://blogs.ft.com/energy-source/2011/03/15/germany-shuts-down-all-pre-1980-nuclear-plants/?utm_source=twitterfeed&utm_medium=twitter


Read more...

If a human slave is 80 Watt/hour, energy algebra of modern life is…

3:52 PM Reporter: Baris Sanli 1 Response

Yesterday, I was reading that new book titled “Energy for a Sustainable World: From the Oil Age to a Sun-Powered Future” by Nicola Armaroli and Vincenzo Balzani.

The book looks pretty interesting, and the figure from “De Rebus Bellicis”( http://en.wikipedia.org/wiki/De_rebus_bellicis) is quite interesting. However what was the funny and witty(or weird) thing was the human-energy algebra done by the writers.

In Chapter 3, “Energy in History”, the writers compare the Roman society and modern society.They first assume human power like a traditional source of power in Watts(http://en.wikipedia.org/wiki/Watt) , like Watts in CFL or light bulbs. They claim:

  • A (slave) people can work constantly at a rate of 50-80 W (in short bursts 800W momentarily p.29)
  • Working animal ranges from 300W (oxen) to 700-800W (for good horse, p.27)

So what is the cost of modern life in terms of slaves? Answers are:

  • Washing machine: 800W : 10 human slaves
  • Electrical heating: 2.5 kW: 30 human slaves
  • A small European Cutter: 3.5kW (work done with this cutter for one hour equals to a work done by 4 human slaves in whole day-10-12 hours I guess)
  • A medium sized car: 80 kW consumes the energy equivalent to 1000 human slaves
  • A Boeing 747-400 needs 80 MW to take off = 1 000 000 human slaves

And it claims, an average Italian citizen has as many as 55 energy slaves 24/7.

They also carried out a cost of energy by slave and gasoline. Since a slave can produce an amount of 800Wh in one day (in 10 hours constantly) and one liter of gasoline’s energy content is 12.9 kWh. So 1 liter of gasoline’s energy = 16 human slaves in all day. That means €0.03 for one human slave/day.

See how cheap the services granted by fossil fuels and modern technology.

Reference:

Energy for a Sustainable World, Nicola Armaroli and Vincenzo Balzani, Wiley -VCH. , 2011

http://www.amazon.com/gp/product/3527325409/ref=pd_lpo_k2_dp_sr_1?pf_rd_p=1278548962&pf_rd_s=lpo-top-stripe-1&pf_rd_t=201&pf_rd_i=0470209836&pf_rd_m=ATVPDKIKX0DER&pf_rd_r=01TSXV71YMTZMH8Q2R6D


Read more...

Energy Vision 2011 - A New Era for Gas

10:20 AM Reporter: Baris Sanli 0 Responses
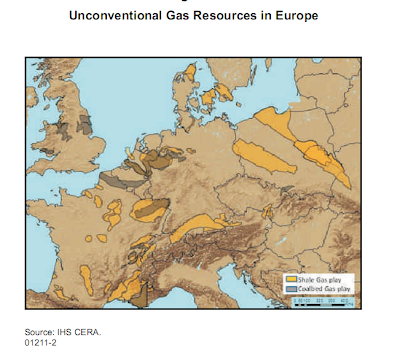
World Economic Forum's report is an interesting piece to read. There are numerous high profile comments in it. However as the #ceraweek suggests, some personal comments contradict with what is inside this report. One of the interesting maps in the report is this:
Also, 2010 gas figures can be found:
2010 Natural Gas Production by Region
Europe, 286 bcm
Middle East, 407 bcm
Africa, 213 bcm
Latin America, 148 bcm
North America, 749 bcm
Former Soviet Union, 751 bcm
Asia, 414 bcm,

Read more...

CERA Week notes from Platts

9:41 PM Reporter: Baris Sanli 0 Responses
Quick Summary
  • "An energy crisis is coming -- likely to be triggered by oil," Hess said.
  • we have already produced 1 trillion barrels and have approximately 2 trillion barrels remaining
  • The energy density of today's best battery is 200 watt-hours per kilogram versus the energy density of gasoline which is 13,000 watt-hours per kilogram
  • steam to oil ratio at many of the oil sands' in situ projects has dropped to 2-2.5, meaning for every unit of oil produced
http://www.platts.com/weblog/oilblog/2011/03/07/cera_week_a_run.html

Read more...

Feb 2011 Update - Turkish Installed Capacity 50004 MW - Peak Demand 32675 MW

1:47 PM Reporter: Baris Sanli 0 Responses
Turkish installed electricity generation capacity reached 50004 MW according to TEİAŞ. It is also noted that peak demand at the system concurred on the Feb 1st, 2011 at 1740 hours with 32675MW. Top daily demand has exceeded 670 GWh on the same day. As of Feb 23rd, 2011, the breakdown of installed capacity is as follows (check official sources to make sure)
  • Natural Gas: 18361.75 MW (including mixed fuels)
  • Hydro: 16159.1 MW
  • Lignite: 8139.6 MW
  • Exported Coal: 3281 MW
  • Fuel Oil : 1448.78 MW
  • Wind : 1357.95 MW
  • Other: 826.7 MW
  • Hard Coal(domestic production): 335 MW
  • Geothermal: 94.2 MW

Source: TEİAŞ


Read more...

Extraordinary IEF Ministerial Meeting - Expansion of Jodidb.org is expected

1:20 PM Reporter: Baris Sanli 0 Responses
According to concluding statement of "Extraordinary IEF Ministerial Meeting" (Feb 22,2010), my favourite oil database will include natural gas data as well as capacity additions.(IEF : International Energy Forum)

Jodidb.org is a website publishing oil statistics for both exporting and importing countries'.

Starting from the final word, the dialogue forum aims to:

  • Mitigate energy market volatility and future uncertainty
  • Better data transparency-Internationally coordinated regulation
  • a better common understanding of energy market trends and energy outlooks

Concluding statement has a summary of three different discussions:

1. Physical and financial markets’ linkages and energy markets regulation : no censensus

  • 1st group "underlined the role of excessive financial speculation in the surge in prices and volatility"
  • 2nd group "especially those involved in price reporting, felt that spot markets set their own prices, independently of any influence from financial markets"
  • 3rd group "it is difficult to construct theoretically and test empirically ... whether market drives the physical or the other way around. "

2. Shared analysis of energy market trends and outlook

Aim: improve clarity and understanding of the various outlooks. (there are comparisons between IEA and OPEC's forecasts)
  • both the IEA and OPEC’s projections were similar in terms of supply/demand growth figures for 2011
  • uncertainities : future demand, economic growth and technological change.

3.Jodi Database (most importantly)The extension of JODI to cover monthly natural gas data is now well under way, The extension of JODI to annual data on upstream and downstream capacities and expansion plans will start with oil and is currently under way, with first results expected at the earliest in 2012.

Ref:
http://www.ief.org/whatsnew/Documents/EMM%20Joint%20Concluding%20Statement.pdf
http://en.wikipedia.org/wiki/International_Energy_Forum
http://www.ief.org/whatsnew/Pages/ExtraordinaryIEFMinisterialMeeting,22February2011,Riyadh.aspx
http://www.jodidb.org/TableViewer/tableView.aspx

Read more...

Direct Facts - Econbrowser's Brent-WTI Spread

12:39 PM Reporter: Baris Sanli 0 Responses
There is plenty of discussion about the spread between WTI-Brent. There are numerous articles on this. What I want to show you is the spread between WTI and others. Econbrowser has a nice graph of this. Textbook says "if there is price differences between two or more markets, arbitrage opportunities exits". (Check this)

Now there are reasons for this price differentials. Paper oil ( "buy WTI futures and sell Brent futures" ) is one of them, but speculators are not as active as in 2007. But website suggests a few solutions:
  • Running the Seaway pipeline, which is currently delivering oil from the (Freeport, Texas) Gulf of Mexico to Oklahoma, in reverse. ConocoPhilips is not interested in this idea because of a fear for political criticsm and most importantly on economical grounds ("As an integrated refiner and producer, it can take its profits either as refinery margin or producer-seller.") . “A reversal would send up to 350,000 barrels a day of crude from Cushing directly to Houston, significantly releasing pressure on the Cushing complex,” said JBC Energy GmbH, a Vienna-based researcher. "
  • "It ... costs $6 to ship a barrel from Cushing to the Gulf of Mexico by rail or $10 by truck"
Ref: Econbrowser
http://www.econbrowser.com/archives/2011/02/brentwti_spread.html

Read more...

Quick Summary of IEA's Libya Brief

12:26 PM Reporter: Baris Sanli 0 Responses
IEA has published a brief on its website you can download it from here. The brief include a nice map of Libya's oil ports. Here is a quick summary:
  • Libya's oil production (crude+NGL): 1.69 million b/d (Jan 2011)
  • 1.49 mb/d is exported. Domestic consumption 270 kb/d
  • 1.2 mb/d is exported to IEA countries.
  • 150 kb/d is exported to China
  • East Libya exports 684-958 kb/d (is there a mistake on page 2?)
  • West Libya exports 199-270 kb/d
  • Biggest importer for Libyan Jet Kerosene and Residual Fuel Oil is Italy, where Turkey, Spain, Germany, Greece and France has minute shares. (page 3, bottom)

  • Libya exports natural gas to Italy(via Greenstream underwater pipeline) and LNG to Spain. Italy imports 26 mcm/d. Spain imports 1.5 mcm/d


Read more...

Houston, We have a problem! - Texas's Rolling Blackouts of February 2011

3:20 PM Reporter: Baris Sanli 0 Responses
On Feb. 2nd 2011 :
A trio of events - loss of supply, higher demand and maintenance outages - led to Wednesday's emergency rolling blackouts across Texas and spiking power prices as the grid operator for most of the state struggled to accommodate a brutal winter storm.
Here is my collection of events from various links...
In 2008, Texas has been on the edge of a rolling blackout.
"On February 26, 2008, the Electric Reliability Council of Texas (ERCOT) called for an Emergency Electric Curtailment Plan (EECP) at 18:41 due to a worsening imbalance between generation and load which led to a decline in system frequency"
Read here (http://www1.eere.energy.gov/windandhydro/pdfs/43373.pdf)

In 2011, (Feb 2 & Feb 3) Texas has suffered from blackouts. The Oil Drum has a nice summary of the events : ( http://www.theoildrum.com/node/7449 )
A summary of events is available from this site : (http://www.oncor.com/news/newsrel/detail.aspx?prid=1297)
"Wednesday’s peak demand is currently projected to be more than 54,000 MW between 8-9 p.m. , and more than 58,000 – which would be a new winter record – between 7-8 a.m. on Thursday. The current winter peak demand record is 56,334 MW which occurred Feb. 2, between 7 and 8 p.m.
The grid continues to have about 2,700 MW of generation capacity unavailable because of unplanned or forced outages."

These 2700 MW of generating capacity are probably these two plants:

Texas Lt. Gov. David Dewhurst said the Luminant-owned 1,640 MW Oak Grove plant east of Temple and the 1,137 MW Sandow plant near Rockdale were among the plants knocked offline by the storm. Oak Grove suffered a broken pipe and Sandow was hampered by a frozen pipe. Allan Koenig, communications director for Luminant, said its Oak Grove and Sandow power plants "accounted for just a small percentage of the 50 units and 7,000 megawatts."

So it was cold weather, pipes and low pressure on natural gas lines:

Wednesday. Lt. Gov. David Dewhurst said this is something that “should not happen.” Dewhurst said he was told that water pipes at two plants, Oak Grove and Sand Hill, forced them to cut electricity production. Natural gas power plants that should have provided back up had difficulty starting due to low pressure in the supply lines, also caused by the cold weather.
I am not quite sure about this:
But, Fraser said, some power cuts affected some stations for compressing natural gas — so without power they couldn't pump gas, causing some gas power plants to go offline
The complaints followed :
"The blackouts left many people angry and frustrated. Cuellar said Oncor’s call center has been overwhelmed with about 60,000 calls an hour."
Also a family blamed these outages for causing their son's death

So the market worked and prices soared to 3000$/ MWh

As a result of the outages and demand, real-time power prices peaked around $3,000/MWh during some intervals Wednesday afternoon.

Average prices at this time of year normally would be less than $100/MWh, Doggett said.
Emergency measures started:

In addition to the default Energy Emergency Alert 0, or normal operations, there are four EEA levels: EEA Level 1, EEA Level 2A, EEA Level 2B and EEA Level 3, which is the most extreme.

ERCOT first contacted market participants at 4:45 am CST on Wednesday to warn the companies of inclement weather. ERCOT declared EEA Level 2A at 5:17 am

Less than a half-hour later, ERCOT declared EEA Level 3 at 5:43 am, at which point the grid operator asked distributors to shed firm load of 1,000 MW, said ERCOT spokeswoman Dottie Roark.
A timeline and detailed discussion is available from here:


More information about Texas home heating is available here

As a final reading, I offer "Normal Accident Theory" from NASA:

Failure in one part (material, human, or organization) may
coincide with the failure of an entirely different part. This
unforeseeable combination can cause cascading failures of
other parts.
In complex systems these possible combinations are practically
limitless.


Read more...

Overseas Activities of Chinese Oil Companies - IEA Report

2:30 PM Reporter: Baris Sanli 0 Responses
IEA has published its new research on Chinese oil companies. The report is full of interesting facts. Also if you follow the sources for graphs you can find valuable reports and presentations such as "Facts Global Energy". My personal feeling is, it is another politically motivated report. Since you can not decouple Chinese Government relations with African countries from Chinese oil companies investments in these countries. However report claims, Chinese oil companies are not the puppets of the government.

IEA facts on China and oil

  • In the next five years, almost half of global oil demand growth will come from China.
  • In 2010, China imported 4.8 million barrels per day of crude oil, up 17.5 % from 2009.
  • By late 2010, Chinese NOCs operated in 31 countries and had equity oil in 20 of these countries.
  • In 2010, China’s NOCs invested nearly USD 16 billion in acquiring assets, such as refineries, in Latin America.
  • 77% of China’s crude oil imports pass through the Strait of Malacca. By 2015, it is estimated that crude oil passing through the Strait to China will rise to 3.5 million barrels per day. In 2009, 3.1 million barrels per day went through the Strait
Links:
http://www.fgenergy.com/?page=article_type&action=read&id=17
http://www.iea.org/papers/2011/overseas_china.pdf

Read more...

Do you think the electric car is a modern invention?

10:05 AM Reporter: Baris Sanli 0 Responses
Electric cars are included in the projections as if they will slowly dominate and replace ICE (internal combustion engines). The following site has all the list of electric car manufacturers in US from 1900s to 1960s (mostly end up 1920s).... So what has happened to these cars? Hardly any manufacturer survived beyond 1920.


Read more...

From Wikileaks to IEA - Credibility of Peak Oil Theory still worths a look

9:31 AM Reporter: Baris Sanli 0 Responses
A graph from the IEA's report WEO 2010 reveals that IEA believes that the world crude oil production (not including NGL or others) has peaked in 2006 or nearby:

Previously, I asked Mr. Fatih Birol, chief economist of IEA in a conference(in 2008) at METU Alumni Association, whether world will see 100 million b/d (current production of crude+ngl+other is hovering around 85-89 mb/d). He briefly described the nuances between crude oil, crude oil+NGL or other associates of crude oil. Then he stated "I don't think so"(for crude oil only). World Energy Outlook 2010 steps further and addresses a peak in crude oil only production as I marked on the graph.
Wikileaks reveal some interesting documents regarding Saudi Production. Sadad Al Husseini retired head of exploration and production for Saudi Aramco, states that Saudi Production can hardly hit 12.5 million b/d and according to documents :
" as he believes that Aramco’s reserves are overstated by as much as 300 billion bbls of “speculative resources.”
the former Aramco board member does believe that a global output plateau will be
reached in the next 5 to 10 years and will last some 15 years, until world oil
production begins to decline." (Wikileaks)

The cable is from December 10, 2007. But there is nothing to confidential about it. Sadad Al Husseini said these things before. He previously to energy bulletin he writes :
"Therefore my answer is: under the current circumstances and outlook, oil is likely to peak at a 95 mmbd plateau by 2015 and can then be sustained well beyond 2020 at increasing real oil prices."(Energy Bulletin)

So are we peaked or are we on the plateou of world oil production? We should better be careful claiming answers to such questions. But it is easier to say that, oil production will suffer from delayed investment. To get a better understanding of oil prices, we should check the storage levels and price trends during the May -driving season-. My personal belief is we are entering another high price cycle unless another economic slowdown happens. It is a risk to write those things openly on the net, since net has a memory. Prices may calm down? I am desperate to see that...

http://www.energybulletin.net/node/9498
http://www.theoildrum.com/node/7102
http://www.wikileaks.ch/cable/2007/12/07RIYADH2441.html

Read more...

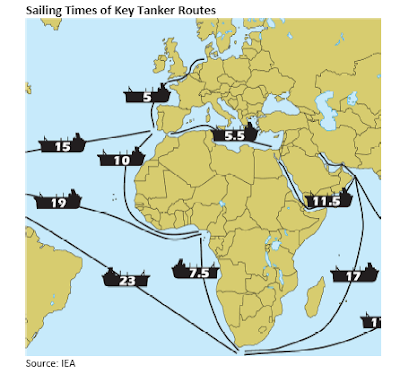
Sailing Times of Tankers

3:07 PM Reporter: Baris Sanli 0 Responses

Read more...

The growing role of Turkey in the EU’s security of energy supply

9:55 AM Reporter: Baris Sanli 0 Responses

A recent policy brief of Turkish Energy Policy from the official sources.


Read here:


By Yusuf Yazar, Deputy Undersecretary, Ministry of Energy and Natural Resources, Turkey

Turkey is dedicated to playing a driving and constructive role in the timely, reliable, cost-effective and environmentally responsible transportation of Caspian, Middle Eastern and Central Asian hydrocarbon resources to European and world markets. To this end Turkey is doing all it can to develop new projects which will enhance its own energy security and those of its partner countries, as well as to bolster prosperity and peace in the region and the world.


Read more...