 While reading this piece from IAEE blog, it occured to me that one needs to have an understanding of the broader affects of energy price increases. So I checked the tables from 2002 from TurkStat's web page.
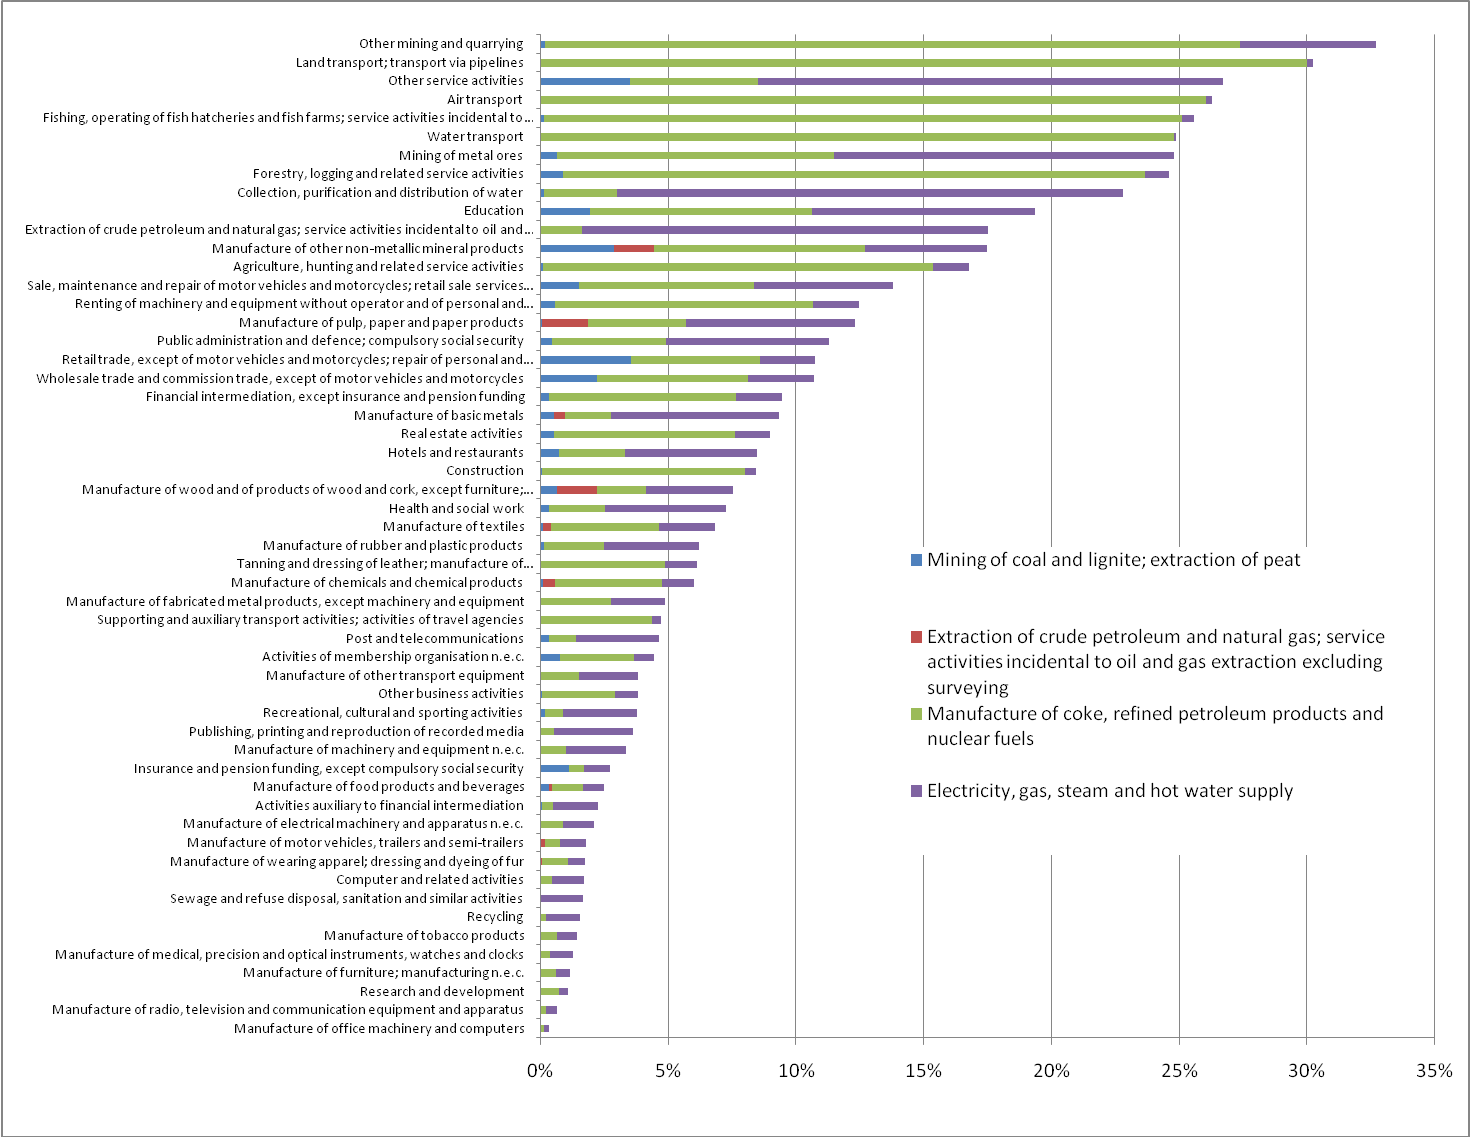
The graph represents the percentage of energy products used in the sectoral output(without value added). As the most energy intensive industries locate at the top, where energy inelastic industries position at the bottom.
Remember this table is from 2002
And the results can be downloaded from here:
https://docs.google.com/leaf?id=0B_ar4GSVZ_k5ODhiMzYyNTEtZWNhOS00Zjc2LWExY2QtNGRjOGE2YzdlMTRh&hl=tr


0 Response to "Turkey's Use Tables - The effect of Energy Inputs on Industries"