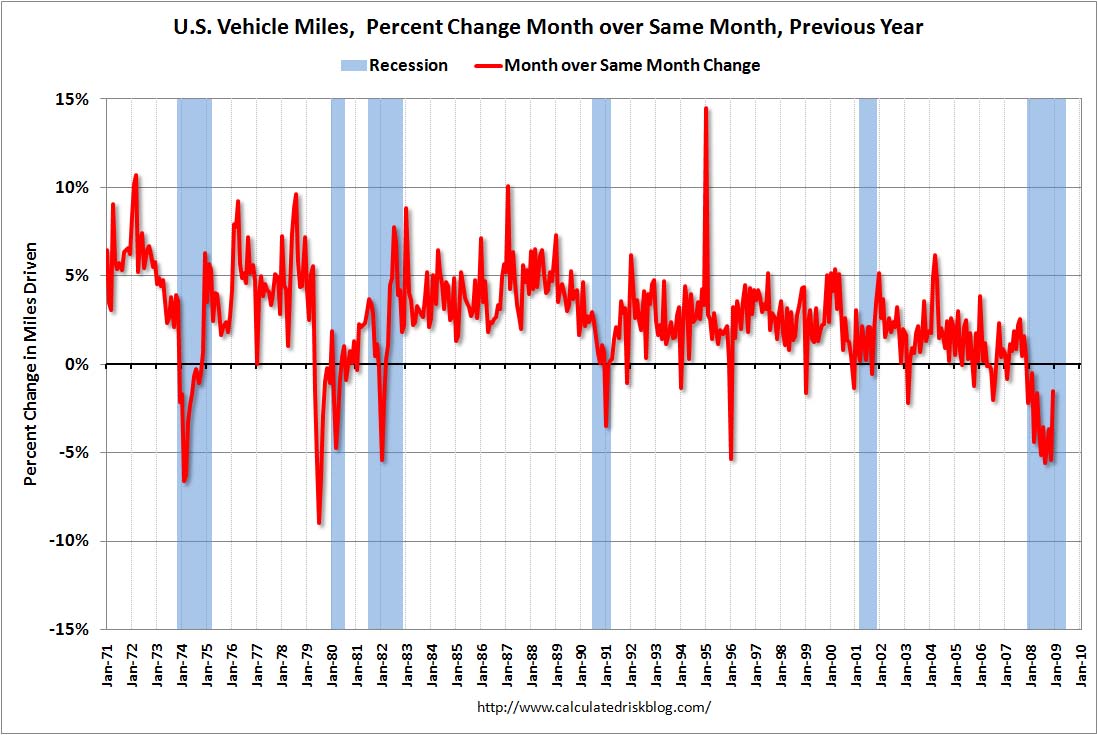
One of my favourite sites on the net is Graphoilogy. Although they do not post that frequently, the site is quite useful for anyone interested in graphs and their relations to oil. Last month they have posted a graph from Traffic Volume Trends:
 Also check this graph, for general driver behaviour:
Data from : http://www.fhwa.dot.gov/ohim/tvtw/tvtpage.cfm
Sources:
http://graphoilogy.blogspot.com/2009/02/vehicle-miles-driven-at-record-low.html
http://www.calculatedriskblog.com/2009/02/us-vehicle-miles-driven-off-36-in-2008.html
Compared with the previous years, the effect of recession looks deeper than 80s.
But comparison may not be accurate, so becareful about the following points:
1. Comparing 80s and 2009 may not yield accurate results, since cars are slightly more efficient (for the US, in Europe they are more efficient). This dampens the effect of oil prices.
2. As commented in the website, the oil price increase was gradual for sometime, so the decrease in traffic volume was shrinking slowly.
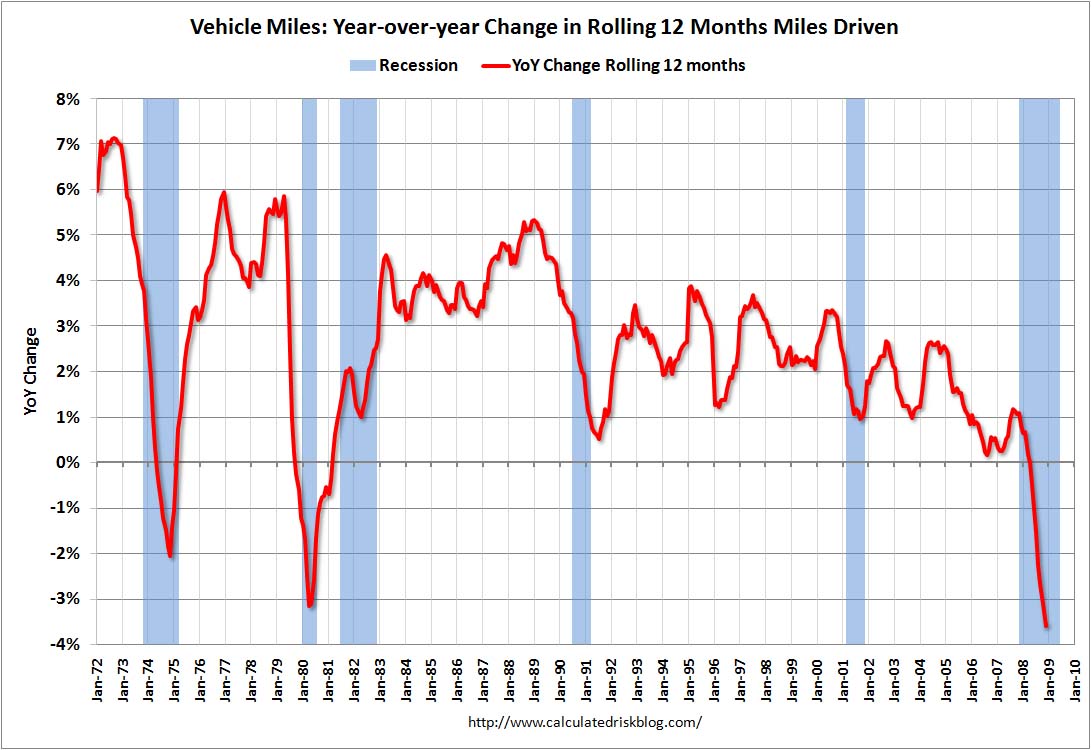
Also check this graph, for general driver behaviour:1. The traffic volume is lowest during winter. And due to cold (and recession), people either stay at home more or save more of their income for heating bills.
2. Since 91, this is the first time YoY change is negative.
Data from : http://www.fhwa.dot.gov/ohim/tvtw/tvtpage.cfm
Sources:
http://graphoilogy.blogspot.com/2009/02/vehicle-miles-driven-at-record-low.html
http://www.calculatedriskblog.com/2009/02/us-vehicle-miles-driven-off-36-in-2008.html


0 Response to "Vehicle Miles Driven : Another indicator for how deep the recession is?"