A few explanations for the sudden fall of oil prices

4:53 PM Reporter: Baris Sanli 0 Responses
There are several explanations but let me summarize that
1. The realization of profits from commodity rush
2. Euro's fall, dollar's rise (read econbrowser link at the end)
3. Inventory levels
4. Demand Destruction
But to have a broader understanding, here is a bunch of explanations from FT (stated from some other source):

-”disappointing global economic headlines” (Platts), referring specifically to an unexpected fall in German industrial orders and the strongest rise in US unemployment since August 2010

-OPEC’s consideration to raise formal quota levels in June

-the death of Osama bin Laden and falling geopolitical risks amid “stabilising tensions” in the Middle East and the end of Nigerian elections

-the end of QE2 in June

-interest rate hikes in India and other Asian countries

-the rise of the dollar amid ECB indications of no imminent further interest rate hike

-the impact of higher fuel and commodity costs

-the general sell-off in commodities, with silver losing 25% of its value since April 25

-George Soros cutting his gold holdings

-a larger-than-expected build in US crude inventories

-a fall by 1.3 million b/d to 18.3 million b/d in US weekly implied demand figures

Ref:
http://blogs.ft.com/energy-source/2011/05/06/explanations-for-the-oil-crash/
http://www.econbrowser.com/archives/2011/05/lower_oil_price.html

Read more...

Seasonal variations in oil prices

5:21 PM Reporter: Baris Sanli 0 Responses
From 321energy.com web site, Frank Holmes has this nice graph, which should be in the collection. The graph shows the seasonal changes in oil prices with 28, 15 and 5 year patterns. It is interesting to see these variations in terms of different time spans.

References
Why high oil prices are likely here to stay?, http://321energy.com/editorials/holmes/holmes041311.html


Read more...

Environmentalists have no one to blame but themselves for failing to sell their climate policies

4:53 PM Reporter: Baris Sanli 0 Responses
After all the climate change discussions, TNR has a review of a report and ideas about why climate change may have failed to achieve the desired goals. Although the game is not over yet, the favourable atmosphere for climate change is not that favourable any more.
At one instance, the writer says:
"Mike Hulme, a climate scientist at the University of East Anglia, has argued that greens mistakenly treated global warming as a run-of-the-mill environmental problem similar to, say, acid rain. But, with acid rain, feasible solutions were already available—namely, scrubbers and low-sulfur coal—that made it relatively straightforward to cap sulfur-dioxide emissions. "
I think this is a key sentence from my viewpoint

References:


Read more...

Oil Prices, Macroeconomics and Shocks...

4:23 PM Reporter: Baris Sanli 0 Responses
There are very good articles on oil prices and macroeconomics. "The oil price and macroeconomy: what's going on?" by Olivier Blanchard and Marianna Riggi claims that the changes in labor markets and monetary policies("structural changes") can be the usual suspects when it comes to resilient economies to oil price hikes. They have two conclusions:
1. "weakening unions, increasing competition and declining minimum wage have made the structure of labor compensation much more flexible in the 2000s than it was in the 1970s"
2. "increased anchoring of inflation expectations, and in particular with the decrease in the response of expected inflation to an oil price surge since the mid-1980s"
There is also "Why are the 2000s so different from the 1970s? A structural interpretation of changes in the macroeconomic effects of oil prices" , from the same writers is also giving the details for such conclusions.

Also, "Some thoughts on Energy independence" from EconBrowser has a good discussion for demand side and supply side effects of oil prices. He concludes : "increasing the substitutability between energy and other consumption goods, and reducing the amount of oil use would mitigate the negative consequences of oil price shocks."

ei2.gif

References:
The oil price and macroeconomy: what's going on?, by Olivier Blanchard and Marianna Riggi http://www.voxeu.org/index.php?q=node/4341
Why are the 2000s so different from the 1970s? A structural interpretation of changes in the macroeconomic effects of oil prices" , http://www.nber.org/papers/w15467
Some thoughts on Energy independence, http://www.econbrowser.com/archives/2011/04/some_thoughts_o_2.html

Read more...

Measuring Energy Security

12:15 PM Reporter: Baris Sanli 0 Responses
"Measuring Energy Security: Trends in the diversification of oil and natural gas supplies" by Gail Cohen, Frederick Joutz and Prakash Loungani is an interesting paper to read. They took several indices (supply, imports, political risks, size of importer countries and distance between capitals ) to measure energy security for natural gas and oil

What is interesting was the trend for oil in the computed index(there is a decrease till 1999 and a rebound in 2003.) Also keep in mind:
"For about two-thirds of the countries, there has been a decrease in CSI values – an
increase in measured energy security – between 2000 and 2008. [...] For quite a few countries, the decrease comes about not so much because of mere diversification in the sources of energy supplies but because of the lower political risk associated with some of their suppliers.", p14
My critique: "it is not just the fuel per se, but the importance of fuel in the main consuming sector and the critical level of this fuel for this sector. See for example transportation and its dependence on oil,

Reference:
http://www.imf.org/external/pubs/ft/wp/2011/wp1139.pdf


Read more...

Turkey's Use Tables - The effect of Energy Inputs on Industries

10:48 AM Reporter: Baris Sanli 0 Responses
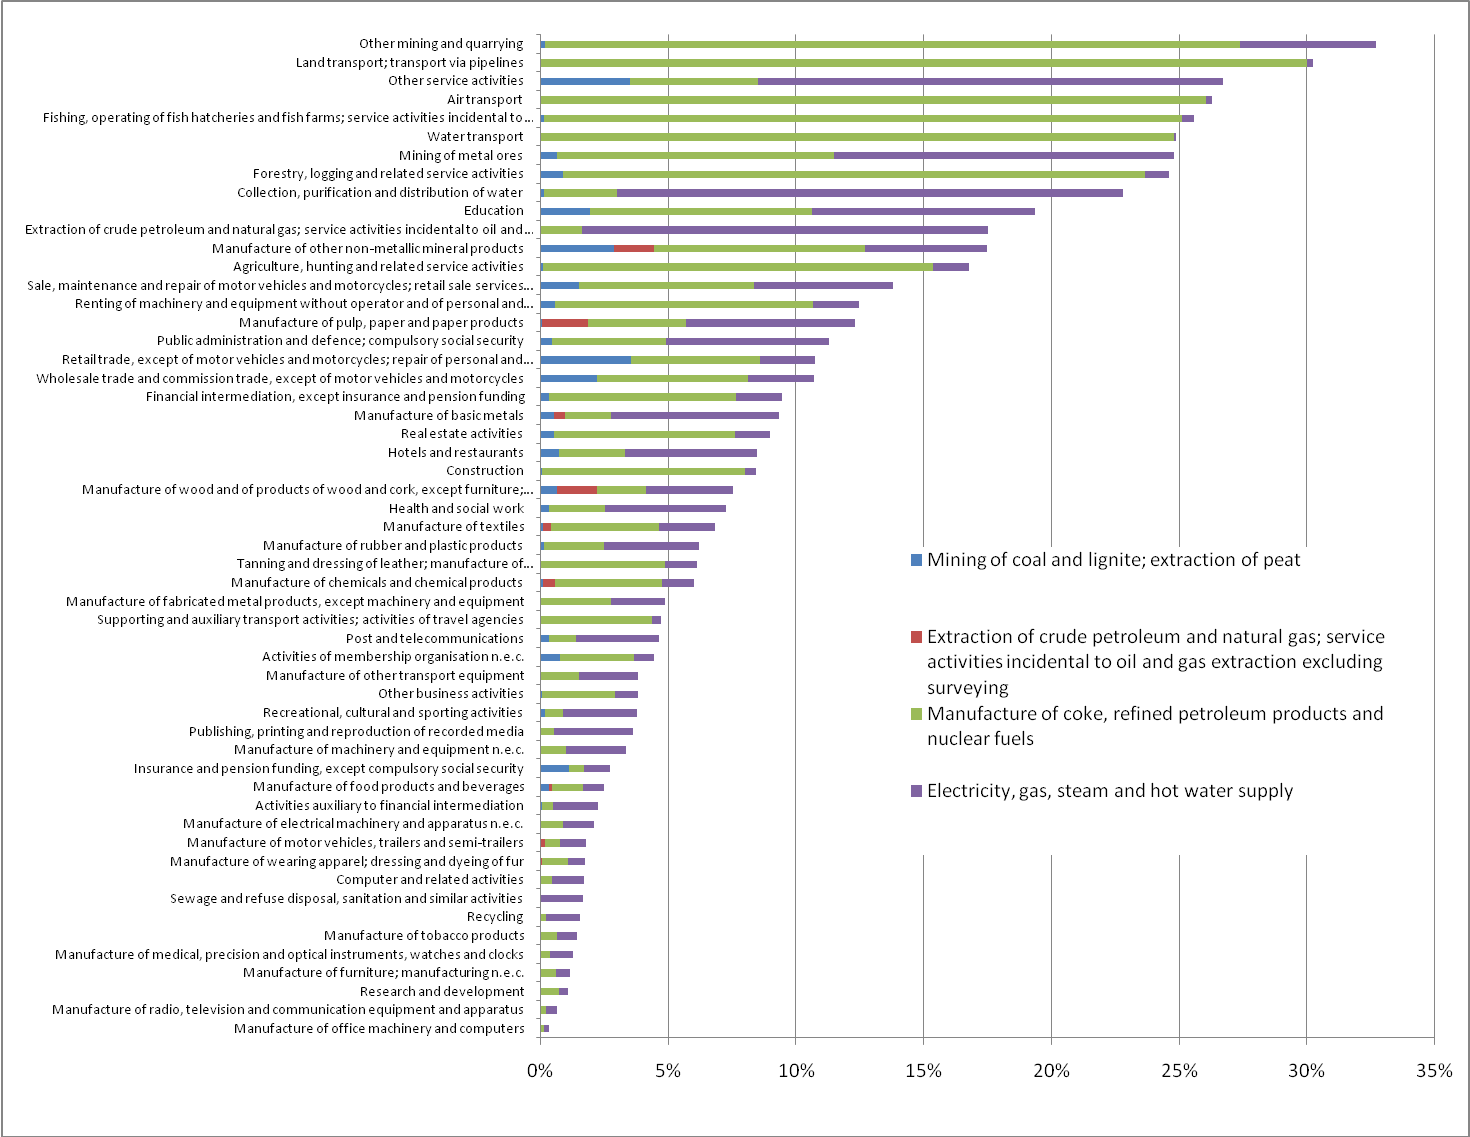
While reading this piece from IAEE blog, it occured to me that one needs to have an understanding of the broader affects of energy price increases. So I checked the tables from 2002 from TurkStat's web page.
The graph represents the percentage of energy products used in the sectoral output(without value added). As the most energy intensive industries locate at the top, where energy inelastic industries position at the bottom.
Remember this table is from 2002
And the results can be downloaded from here:

https://docs.google.com/leaf?id=0B_ar4GSVZ_k5ODhiMzYyNTEtZWNhOS00Zjc2LWExY2QtNGRjOGE2YzdlMTRh&hl=tr

Read more...

The effects of Japanese Tsunami and Nuclear Problem

3:02 PM Reporter: Baris Sanli 0 Responses

Demand Side:
1.
“At least five Japanese-owned refineris with total capacity 1.5 million b/d (1/3rd of Japanese capacity is shutdown)” (Ref:1)
2. “Some 9.7 Gw of nuclear power generation—30% of Japan’s total nuclear power capacity and 7% of Japan’s total power generation capacity—were shut down” (Ref:1)
3. 9.7 GW= 9.7*8.000=77.6 TWh of nuclear energy should be substituted by natural gas and coal. Assuming 50% of this lost capacity to be substituted by LNG = 38.8 TWh. That much of electricity can be obtained by at least 7.09 bcm of LNG (Sources claim as much as 10 bcm)
4. Estimated additional demand of coal can be 5m-30m tonnes (Ref:2)

International Markets:
1.
Natural gas prices : up 7.7% (Ref:2)
2. Oil : down 1.94% (Ref:2)
3. Coal: By April 1, previous record of $125/ton (Australia) may be topped. (Ref:2)

European Nuclear Firms:
-
European energy firms like EON(-8.52%) , RWE (-%7.95), EDF (-11%) (Ref:3)
- Also check mining firms from here : Ref:3
- "German Chancellor Angela Merkel said on Tuesday that all seven of the country’s nuclear power plants which began operation before 1980 would be provisionally shut down." (Ref:5)


Finance:
- There is probably more uninsured damage in the destruction of North East Japan than in any other event in history – and uninsured damage falls sharply on banks. (Ref:4)

Ref:1
http://www.cges.co.uk/media/articles/2011/03/15/japan-quake-scrambles-market
Ref:2 http://blogs.ft.com/energy-source/2011/03/14/energy-market-disruption-in-figures/
Ref:3 http://ftalphaville.ft.com/blog/2011/03/15/514546/euro-nuclear-paralysed-and-paralysing/?utm_source=twitterfeed&utm_medium=twitter
Ref:4 http://ftalphaville.ft.com/blog/2011/03/14/513446/super-catastrophe-and-super-banking-risk
Ref:5 http://blogs.ft.com/energy-source/2011/03/15/germany-shuts-down-all-pre-1980-nuclear-plants/?utm_source=twitterfeed&utm_medium=twitter


Read more...

If a human slave is 80 Watt/hour, energy algebra of modern life is…

3:52 PM Reporter: Baris Sanli 1 Response

Yesterday, I was reading that new book titled “Energy for a Sustainable World: From the Oil Age to a Sun-Powered Future” by Nicola Armaroli and Vincenzo Balzani.

The book looks pretty interesting, and the figure from “De Rebus Bellicis”( http://en.wikipedia.org/wiki/De_rebus_bellicis) is quite interesting. However what was the funny and witty(or weird) thing was the human-energy algebra done by the writers.

In Chapter 3, “Energy in History”, the writers compare the Roman society and modern society.They first assume human power like a traditional source of power in Watts(http://en.wikipedia.org/wiki/Watt) , like Watts in CFL or light bulbs. They claim:

  • A (slave) people can work constantly at a rate of 50-80 W (in short bursts 800W momentarily p.29)
  • Working animal ranges from 300W (oxen) to 700-800W (for good horse, p.27)

So what is the cost of modern life in terms of slaves? Answers are:

  • Washing machine: 800W : 10 human slaves
  • Electrical heating: 2.5 kW: 30 human slaves
  • A small European Cutter: 3.5kW (work done with this cutter for one hour equals to a work done by 4 human slaves in whole day-10-12 hours I guess)
  • A medium sized car: 80 kW consumes the energy equivalent to 1000 human slaves
  • A Boeing 747-400 needs 80 MW to take off = 1 000 000 human slaves

And it claims, an average Italian citizen has as many as 55 energy slaves 24/7.

They also carried out a cost of energy by slave and gasoline. Since a slave can produce an amount of 800Wh in one day (in 10 hours constantly) and one liter of gasoline’s energy content is 12.9 kWh. So 1 liter of gasoline’s energy = 16 human slaves in all day. That means €0.03 for one human slave/day.

See how cheap the services granted by fossil fuels and modern technology.

Reference:

Energy for a Sustainable World, Nicola Armaroli and Vincenzo Balzani, Wiley -VCH. , 2011

http://www.amazon.com/gp/product/3527325409/ref=pd_lpo_k2_dp_sr_1?pf_rd_p=1278548962&pf_rd_s=lpo-top-stripe-1&pf_rd_t=201&pf_rd_i=0470209836&pf_rd_m=ATVPDKIKX0DER&pf_rd_r=01TSXV71YMTZMH8Q2R6D


Read more...

Energy Vision 2011 - A New Era for Gas

10:20 AM Reporter: Baris Sanli 0 Responses
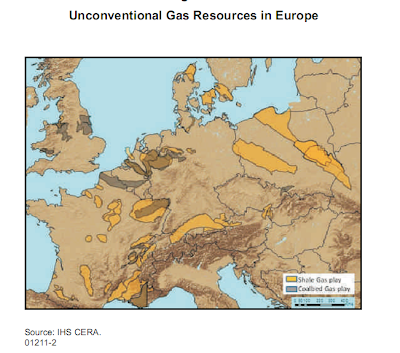
World Economic Forum's report is an interesting piece to read. There are numerous high profile comments in it. However as the #ceraweek suggests, some personal comments contradict with what is inside this report. One of the interesting maps in the report is this:
Also, 2010 gas figures can be found:
2010 Natural Gas Production by Region
Europe, 286 bcm
Middle East, 407 bcm
Africa, 213 bcm
Latin America, 148 bcm
North America, 749 bcm
Former Soviet Union, 751 bcm
Asia, 414 bcm,

Read more...