10:20 AM
Reporter:
Baris Sanli
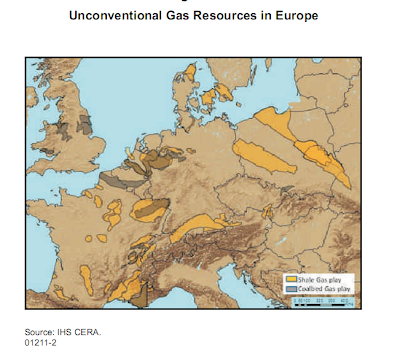
World Economic Forum's report is an interesting piece to read. There are numerous high profile comments in it. However as the #ceraweek suggests, some personal comments contradict with what is inside this report. One of the interesting maps in the report is this:
 Also, 2010 gas figures can be found:
2010 Natural Gas Production by Region
Europe, 286 bcm
Middle East, 407 bcm
Africa, 213 bcm
Latin America, 148 bcm
North America, 749 bcm
Former Soviet Union, 751 bcm
Asia, 414 bcm,
Read more...
2:30 PM
Reporter:
Baris Sanli
IEA has
published its new research on Chinese oil companies.
The report is full of interesting facts. Also if you follow the sources for graphs you can find valuable reports and presentations such as "
Facts Global Energy". My personal feeling is, it is another politically motivated report. Since you can not decouple Chinese Government relations with African countries from Chinese oil companies investments in these countries. However report claims, Chinese oil companies are not the puppets of the government.

IEA facts on China and oil
- In the next five years, almost half of global oil demand growth will come from China.
- In 2010, China imported 4.8 million barrels per day of crude oil, up 17.5 % from 2009.
- By late 2010, Chinese NOCs operated in 31 countries and had equity oil in 20 of these countries.
- In 2010, China’s NOCs invested nearly USD 16 billion in acquiring assets, such as refineries, in Latin America.
- 77% of China’s crude oil imports pass through the Strait of Malacca. By 2015, it is estimated that crude oil passing through the Strait to China will rise to 3.5 million barrels per day. In 2009, 3.1 million barrels per day went through the Strait
Links:
http://www.fgenergy.com/?page=article_type&action=read&id=17http://www.iea.org/papers/2011/overseas_china.pdf
Read more...
5:39 PM
Reporter:
Baris Sanli

Just like EIA or IEA, oil firms have their own energy outlooks. Exxon's Energy Outlook can be downloaded from their
website.
- Energy demand forecasts are down from 1.3% to 1.2% in this study
- Fossil fuels will provide 80% of global energy demand by 2030
- Power generation will see the fastest growth
- Energy for transportation: Flat in developed countries, doubles in developing ones
- CO2 emissions rise 30% from 2005 to 2030
Also new section, called “The Energy Imperative,” outlines the need for an integrated set of solutions that includes improved energy efficiency, development of all economically viable energy sources, and cost-effective steps to curb emissions
Ref:
Read more...
7:57 PM
Reporter:
Baris Sanli

I found the following website and report quite useful for understanding oil shocks followed by recessions. Here is a list of my key points:
1. "the drops in overall spending that were caused by higher oil prices proved to be the knockout punch for an economy that was already wobbly"
2."The fact that the biggest drop in output didn't occur until well after the oil price went up, and resulted not from the oil price itself but instead from the interaction with other factors and the dynamic forces unleashed when the overall level of economic activity began to decline, is also exactly the same pattern we saw in each of the previous recessions."
3."Was the oil shock of 2007-08 the sole cause of the recession? Certainly not. But did it make a material contribution? In my opinion, the answer unquestionably is yes."
Read more...
7:20 PM
Reporter:
Baris Sanli

This version of the report starts with the criticization of IEA numbers, especially China. Crude Oil production is down by nearly 3 million barrels (not world liquid production). Check the oil demand of OPEC countries! There is a big drop in their demand as well. Also, have a look to the Mexico, UK and Norway.
Report is available here (Peakoil.nl)
Read more...
10:05 AM
Reporter:
Baris Sanli
"
The Oilwatch Monthly is a newsletter that is available free of charge with the latest data on oil supply, demand, oil stocks, spare capacity and exports." (The Oil Drum).
This report is quite useful for getting information about world's prominent oil producers and consumers. It is like an open source, illustrated version of IEA's Oil Market Report. The monthly is prepared by "
Peak Oil Netherlands". In this edition, check for
Russian, Egyptian, Malaysian and
Mexican productions and
US,
OECD and EU consumptions.

You can download the report from
here. Following excerpts are from the intro:
"
Instead the cartel is going to focus on reaching 100% compliance with the earlier cuts totalling 4.2 million b/d, between now and its next meeting on 28 of May. So far 80% compliance has been reached, with 3.4 million b/d from 36.08 million b/d total produced last October being cut, resulting in 32.68 million b/d of liquids produced in February 2009. "
"
OECD demand in December 2008 was 788,000 b/d lower than in july 2008, OPEC-11 (excluding iraq) was 650,000 b/d lower than in July, and Chinese demand was 687,000 b/d lower. A total decline of more than 2 million b/d, while OPEC in December had only cut production by 1.26 million b/d.""More recent figures from the Energy Information Administration show that crude oil stocks in the USA increased from 334 million barrels in January to 350 million barrels in February, a level not seen since the beginning of the 1990s. On top of the commercial stocks on land the 50 to 80 million barrels of floating storage in oil tankers on the seas still remain."
Oil Watch Monthly: March 2009
http://www.peakoil.nl/wp-content/uploads/2009/03/2009_march_oilwatch_monthly.pdf
Read more...


