10:11 AM
Reporter:
Baris Sanli
Read more...
11:31 AM
Reporter:
Baris Sanli

As the trust towards paper money decreased, I am wondering whether the oil is priced with gold... After checking several statistics, there is a Beta distribution of Gold price/WTI price ratio.
So far 15-17 is a ratio between gold and wti. Therefore in the following month (August,2011), numbers point to oil prices of 110$ (WTI), and 130$ Brent.
Note on 5 August 2011: I expected the panic to start by end of August. However seems like it has been already started.. So the recent panic has broken the relation. Gold is on the rise, oil is down..... This is a typical ringing bell of a recession... Next time I should state "ceteris paribus":)
One thing to watch is the base price level of oil...
www.barissanli.com
Read more...
9:58 AM
Reporter:
Baris Sanli
Last week an investor told me some interesting numbers regarding wind energy consent times and number of authorities liaise with. So I decided to make my own research:
Read this
The Wind Barriers project also investigated the number of authorities that need to be contacted in each country in order to obtain permission to build onshore. Denmark has the fewest authorities to contact, just five, whereas Greece has the most authorities to contact, with 41. But there is not a direct correlation between the length of time it takes to get permission and the number of authorities that need to be contacted.
The experience in the offshore sector is, so far, more positive. The average time to get the green light is 18 months, much lower than onshore. “A number of countries with offshore wind farms have developed an efficient decision making process for this sector, thereby reducing the complexity for offshore wind developers,” concluded Wilkes.

Ref:http://www.ewea.org/index.php?id=60&no_cache=1&tx_ttnews%5Btt_news%5D=1834&tx_ttnews%5BbackPid%5D
Read more...
4:06 PM
Reporter:
Baris Sanli

Recently I have completed a study on the effect of Carbon prices on Turkish electricity prices. Here is my result (Electricity supply curve MW vs $cent/kWh)
Read more...
5:25 PM
Reporter:
Baris Sanli
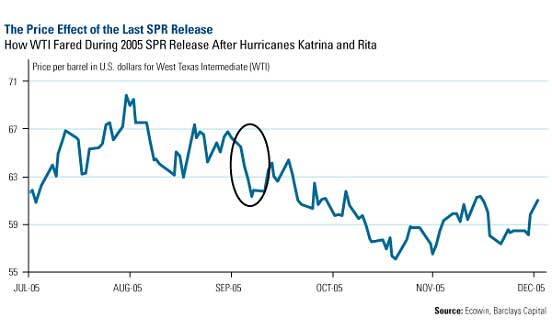
Previous SPR's effect (During Katrina)

On the 23rd June 2011, IEA has decided to release 60million barrels from its 28 members' reserves.
IEA members have 4.1 billion barrels of stocks, some 1.4 billion barrels is for emergency.
They will release 2 million barrels/day for the initial 30 days.
The question is whether this reserves can be traded freely like a normal reserve? Buyers of SPR may not sell it to overseas (Platts)
- "The auction for 30 million barrels of light sweet crude starts at 1 p.m. CDT on Wednesday, with deliveries occurring between August 1-31."
- ""No, you cannot sell to Latin America or China," DOE said in an explainer posted to its website. "SPR petroleum may be exported only with an export license and in connection with the return of refined products to the US.""
- "The US share [30 million barrels] represents 4% of its current stockpile of 727 million barrels"
- U.S. holds (56 percent) while Japan (24 percent), Europe (14 percent) and Korea (6 percent) of the SPRs.(321 energy)

Ref:
http://www.iea.org/press/pressdetail.asp?PRESS_REL_ID=418
http://www.platts.com/RSSFeedDetailedNews/RSSFeed/Oil/6229240
http://321energy.com/editorials/holmes/holmes0062811.html
Read more...
5:19 PM
Reporter:
Baris Sanli
Platts has this news item with lots of useful numbers:
In India
- 80000 MW of coal plants under construction
- Target of adding 100000 MW in the next 5 years
- Environmental problems for local coal prevented 203 mines that can fuel 130000 MW
- Coal India produces 80% of national production
Reference
Platts, http://www.platts.com/NewsFeature/2011/CoalFired/index
Read more...
5:19 PM
Reporter:
Baris Sanli
Manouchehr Takin from Center for Global Energy Studies has a brief summary of oil production capacity costs
here.
Here is a summary. Remember that the units is per peak daily barrel. That is if you want to build a 100.000 barrels per day peak capacity for Haradh III, you have to invest $2,500*100.000 = 250 million dollars at least."
Saudi Arabia
- $2,500 (per peak daily barrel) for development of the Haradh III zone of the supergiant Ghawar oilfield
- $10,000 for the massive Khurais et al development a
- $17,500 for the Manifa field
-$40,000 heavy oil projects of Iran
-$85,000 supergiant Kashagan field in Kazakhstan
"
Ref:
The cost of Saudi Arabia’s oil production capacity, Manouchehr Takin, http://www.cges.co.uk/resources/articles/2011/06/21/the-cost-of-saudi-arabia%E2%80%99s-oil-production-capacity
Read more...
11:41 AM
Reporter:
Baris Sanli

Ernst&Young has an interesting indice that you can find from here:
http://www.ey.com/GL/en/Industries/Power---Utilities/Renewable-energy-country-attractiveness-indices
The report also includes one page review of some countries including China, UK, Poland and Chile.
Country Attractiveness Indices:
http://www.ey.com/GL/en/Industries/Oil---Gas/Oil_Gas_Renewable_Energy_Attractiveness-Indices
Recent Index
http://www.ey.com/GL/en/Industries/Power---Utilities/Renewable-energy-country-attractiveness-indices
Read more...
4:53 PM
Reporter:
Baris Sanli
There are several explanations but let me summarize that
1. The realization of profits from commodity rush
2. Euro's fall, dollar's rise (read econbrowser link at the end)
3. Inventory levels
4. Demand Destruction
But to have a broader understanding, here is a bunch of explanations from FT (stated from some other source):
-”disappointing global economic headlines” (Platts), referring specifically to an unexpected fall in German industrial orders and the strongest rise in US unemployment since August 2010
-OPEC’s consideration to raise formal quota levels in June
-the death of Osama bin Laden and falling geopolitical risks amid “stabilising tensions” in the Middle East and the end of Nigerian elections
-the end of QE2 in June
-interest rate hikes in India and other Asian countries
-the rise of the dollar amid ECB indications of no imminent further interest rate hike
-the impact of higher fuel and commodity costs
-the general sell-off in commodities, with silver losing 25% of its value since April 25
-George Soros cutting his gold holdings
-a larger-than-expected build in US crude inventories
-a fall by 1.3 million b/d to 18.3 million b/d in US weekly implied demand figures
Ref:
http://blogs.ft.com/energy-source/2011/05/06/explanations-for-the-oil-crash/
http://www.econbrowser.com/archives/2011/05/lower_oil_price.html
Read more...




 Posts


