Interactive Rig Count - Baker Hughes

7:07 PM Reporter: Baris Sanli 0 Responses
Baker Hughes(BH) has a very interesting interactive map, that shows you the locations of various drilling activites. It is a sample of their professional work. Their reports are a good indicator for drilling activities. For example, check the following dates and you can easily observe the effects of recession.

On 28 March 2008, there were 1808 rig counts by BH, by the same period in 2009, this number dropped to 1085. A staggering 769 drop. A 42% drop....Report for 30 March 2009.

You can also access the interactive web page from here .or here.
From the page, you can select from various parameters and see the latest data. It is limited to US however it gives a good activity about oil in the world's biggest consumer. On the date I checked it, gas activity was higher than oil activity.


Links:

Report: http://gis.bakerhughesdirect.com/Reports/StandardReport.aspx

Interactive map: http://gis.bakerhughesdirect.com/RigCounts/default2.aspx
or try this link: http://gis.bakerhughesdirect.com/RigCounts/

Read more...

World Energy Projection System of 2002

6:54 PM Reporter: Baris Sanli 0 Responses
World Energy Projection system is an old model that Department of Energy, US once used for some of their projections. It looks like more of an accountant's balance sheets, but you can download and check the validity of the model for fun, it will be a good exercise.


Model can be downloaded from here and documentation is here. In the document you can find the relevant informations about using the files.

"The World Energy Projection System (WEPS) was developed by the Office of Integrated Analysis and Forecasting within the Energy Information Administration (EIA), the independent statistical and analytical agency of the U.S. Department of Energy. WEPS is an integrated set of personal computer-based spreadsheets containing data compilations, assumption specifications, descriptive analysis procedures, and projection models. The WEPS accounting framework incorporates projections from independently documented models and assumptions about the future energy intensity of economic activity (ratios of total energy consumption divided by gross domestic product [GDP]), and about the rate of incremental energy requirements met by natural gas, coal, and renewable energy sources (hydroelectricity, geothermal, solar, wind, biomass, and other renewable resources). Projections produced by WEPS are published in the annual report, International Energy Outlook."

http://www.eia.doe.gov/oiaf/ieo/weps/
Doc: http://tonto.eia.doe.gov/FTPROOT/modeldoc/m05097.pdf

Read more...

Building Dashboards - Lucid Design

6:39 PM Reporter: Baris Sanli 0 Responses
While surfing on the net to find some interactive pages about Gridwise Goodwatts, I found the following pages. Building dashboards are interactive webpages that show you the resources you use ( electricity, water, gas) as well as solar generation and water recycling (grey water.). They have a starter package and some of their customers are big names (Like Yahoo). The current use of this technology may be to improve energy use of people, but this is step forward for smart grid-metering technologies. There is a link to the demo page too.
Lucid Design Group explains some of their services as follows :

".... features an easy-to-understand, web-based display for providing occupants with real-time feedback on resource use. Check out your consumption right now, or look at consumption patterns over time. See how many dollars you're spending or pounds of carbon dioxide you're emitting into the atmosphere. Go a step further and instantly compare your building's usage with another monitored building, or launch a competition and rival your friends and coworkers to reduce their consumption."

They also have a demo page for you to see what other things is possible with the starter kit. You can compare per person consumption, between different buildings and etc. 5 stars


http://www.luciddesigngroup.com/
Demo: http://www.buildingdashboard.com/demo/starter/
Other dashboards: http://buildingdashboard.com/clients/uvm/davis/ , Cubolder , EcoManor, Yahoo , SweetWater

Read more...

A new financial system?

11:20 AM Reporter: Baris Sanli 0 Responses
Nowadays when making oil price forecasts, one should also consider how the dollar's value will change. Before the G20 in London, interesting discussions are going on.

For example read this from WSJ:

"China called for the creation of a new currency to eventually replace the dollar as the world's standard, proposing a sweeping overhaul of global finance that reflects developing nations' growing unhappiness with the U.S. role in the world economy."

China is not alone, Stiglitz says :"The dollar reserve system is part of the problem," Joseph Stiglitz, the Columbia University economist, said in a speech in Shanghai last week, because it meant so much of the world's cash was funneled into the U.S. "We need a global reserve system," he said in the speech. (WSJ)


Now check the currency reserves of nations:


If there are concerns about dollar's long term future (we do not expect any radical changes in the short term), oil's value in terms of other commodities may stay same but in terms of dollars oil prices may rise.


WSJ : China Takes Aim at Dollar
Chinese Central Bank : Reform the International Monetary System


Read more...

Crude oil - Gold - Euro/USD parity

8:41 PM Reporter: Baris Sanli 0 Responses
The relation between crude oil vs gold and euro is the question I am looking for some time. From my initial studies, following graphs give an idea.

In this graph, log of crude oil is vertical axis and log of crude oil is the horizontal axis

Then check this one:


My conclusions:
1 - Crude and square of euro/dollar parity is in harmony
2 - Recession started hitting by the end of september 2008
3 - Crude and gold relation is broken for sometime
4 - Observe the euro's appreciation against dollar and rise in crude prices

All this means is crude prices will rise, since dollar will lose some of its value. By the end of May 2009, there is a great possibility that we may see 65-70 $ if dollar continues its slow depreciation. May is the start of driving season.


Read more...

World Energy Geology : Interactive Map

1:43 PM Reporter: Baris Sanli 0 Responses
US Geological Survey is one of the most important sources for world petroleum endowment. They have an interactive map, which eases to plot the results of survey. The results of their studies are used as inputs to other very important studies carried by international organizations such as IEA. Some criticize USGS for being bountiful in their expectations. Especially after last year's oil price hike, experts talked about re-examining USGS data.


Neverthless, map is quite nice and user friendly. Also check the other web pages as well. Beware that the results may be old (from 2000).


Map can be reached from this website:
Also check :

Read more...

Bottom of economic crises: Are we there yet?

11:09 AM Reporter: Baris Sanli 0 Responses
One of my friends has shared the following article from New York Times which I enjoyed reading. The article tries to find out whether we reached the "bottom of recession", using several indicators. It looks to three indicators:

1. Stocks:
"Price to earning ratio. History shows that the stock market usually hits bottom before the economy does.The price-to-earnings ratio — which investors use to gauge how much they are paying for each dollar of corporate profit — is around 13, about 20 percent lower than the average of the last 130 years."

2. Home prices: "Barry Ritholtz, a professional investor who writes the popular economics blog The Big Picture, has a simpler, more subjective, approach: Assume a young couple earning two modest incomes is looking to buy a two- or three-bedroom starter home in a middle-income neighborhood in your city. Can they qualify for a mortgage and afford to buy it?“If the answer is no, then you are not at a bottom in housing,” said Mr. Ritholtz, who estimates that the decline in national home prices is only half-complete. "

3. Consumer spending:" The savings rate — the amount of money consumers did not spend — jumped to about 3 percent late last year, from practically zero, still far below its postwar average of 7 percent. ... In a study of economic cycles, Edward E. Leamer, an economist at the Anderson School of Management at the University of California at Los Angeles, found that auto sales and home building tended to lead recoveries."


Also, mentioned in the article is the 12% shrinkage of imports and exports of US in January.

Take that and compare with the news about Chinese exports appeared in EconBrowser.com.


According to Wang Qian, a Hong Kong-based economist at JPMorgan Chase & Co. :
"There's no hope for export demand to recover any time soon. ... How fast imports recover depends on how soon the government's stimulus package kicks in and creates real demand in major industries." (Bloomberg)

I think the most amusing part of the story is also from New York Times : "Tobias Levkovich, chief United States equity strategist at Citigroup, has another indicator for spotting when we have hit bottom: When we stop behaving like children in the backseat of the car asking their parents, “Are we there yet?” "
Sources:

Read more...

Oilwatch : March 2009

10:05 AM Reporter: Baris Sanli 0 Responses
"The Oilwatch Monthly is a newsletter that is available free of charge with the latest data on oil supply, demand, oil stocks, spare capacity and exports." (The Oil Drum).


This report is quite useful for getting information about world's prominent oil producers and consumers. It is like an open source, illustrated version of IEA's Oil Market Report. The monthly is prepared by "Peak Oil Netherlands". In this edition, check for Russian, Egyptian, Malaysian and Mexican productions and US, OECD and EU consumptions.
You can download the report from here. Following excerpts are from the intro:

"Instead the cartel is going to focus on reaching 100% compliance with the earlier cuts totalling 4.2 million b/d, between now and its next meeting on 28 of May. So far 80% compliance has been reached, with 3.4 million b/d from 36.08 million b/d total produced last October being cut, resulting in 32.68 million b/d of liquids produced in February 2009. "

"OECD demand in December 2008 was 788,000 b/d lower than in july 2008, OPEC-11 (excluding iraq) was 650,000 b/d lower than in July, and Chinese demand was 687,000 b/d lower. A total decline of more than 2 million b/d, while OPEC in December had only cut production by 1.26 million b/d."

"More recent figures from the Energy Information Administration show that crude oil stocks in the USA increased from 334 million barrels in January to 350 million barrels in February, a level not seen since the beginning of the 1990s. On top of the commercial stocks on land the 50 to 80 million barrels of floating storage in oil tankers on the seas still remain."


Oil Watch Monthly: March 2009
http://www.peakoil.nl/wp-content/uploads/2009/03/2009_march_oilwatch_monthly.pdf

Read more...

Cost of Building A New Generating Plant

6:06 PM Reporter: Baris Sanli 0 Responses
Maybe a bit of history but the following numbers worth a look. This is published in June, 2008. Dolar is appreciated since then and commodity prices have collapsed.

Check this report (Page 11)
"What do all these cost increases mean for the cost of building a new generating
plant?"


"No one knows precisely. It’s difficult to get consistent and trustworthy numbers about plant costs, both because they are commercially sensitive and because the assumptions behind them vary greatly. The numbers reflected on the slide come from a variety of sources and include different assumptions about, for example, location or exactly what facilities are included in the estimate. To take one example: Two recent nuclear procurements in South Carolina and Georgia produced cost estimates of $5,100 and $6,400 per kW, respectively, for the same technology. We have been told that most of the difference may be due to different uses of Allowances for Funds Used during Construction – AFUDC."


Source:http://www.ferc.gov/legal/staff-reports/06-19-08-cost-electric.pdf


Read more...

Brief : 13 March 2009

5:39 PM Reporter: Baris Sanli 0 Responses
Oil prices inched toward $43 a barrel Thursday in Asia after an unexpected rise in U.S. crude inventories, suggesting demand remains poor, sparked a big drop in prices overnight (Yahoo)

"The deepening economic gloom should, in theory, support the case for a new cut. Yet the group has still not managed to reduce output to the target level, though at a compliance rate just short of 80%, it's very close." (Rigzone)

Venezuela gross domestic product will shrink 4.1 percent in 2009 as revenue from oil sales plunges by $50 billion (Bloomberg)

Daniel Yergin : "We're now in the Great Recession, and that's what the price reflects....GDP is going to determine the price. .... Oil is not only the world's most important commodity, it's a barometer of the global economy .... OPEC, "like everyone else, is trying to understand the depths of the recession"

Russian President Dmitry Medvedev underscored here on Thursday his country's interest in fair and stable price for oil in world markets. Russia’s ruble plunged the most in almost three weeks against the dollar as Russia’s largest privately owned bank forecast a 20 percent depreciation and the price of oil continued to decline. Russian reserves fell $3.8 billion to $380.5 billion last week, after rising $2.4 billion in the previous week, Bank Rossii said today. Russian investors and locals have withdrawn and converted more than $300 billion since August. (Bloomberg)

Oil output capacity will likely decrease worldwide over the next few years as producers curtail their investments in response to lower crude prices, a regional energy specialist said on Wednesday.

The world population is projected to top nine billion in 2050, up from 6.8 billion this year and seven billion early in 2012, according to UN estimates released Wednesday

Read more...

Vehicle Miles Driven : Another indicator for how deep the recession is?

4:05 PM Reporter: Baris Sanli 0 Responses
One of my favourite sites on the net is Graphoilogy. Although they do not post that frequently, the site is quite useful for anyone interested in graphs and their relations to oil. Last month they have posted a graph from Traffic Volume Trends:

Compared with the previous years, the effect of recession looks deeper than 80s.
But comparison may not be accurate, so becareful about the following points:

1. Comparing 80s and 2009 may not yield accurate results, since cars are slightly more efficient (for the US, in Europe they are more efficient). This dampens the effect of oil prices.

2. As commented in the website, the oil price increase was gradual for sometime, so the decrease in traffic volume was shrinking slowly.

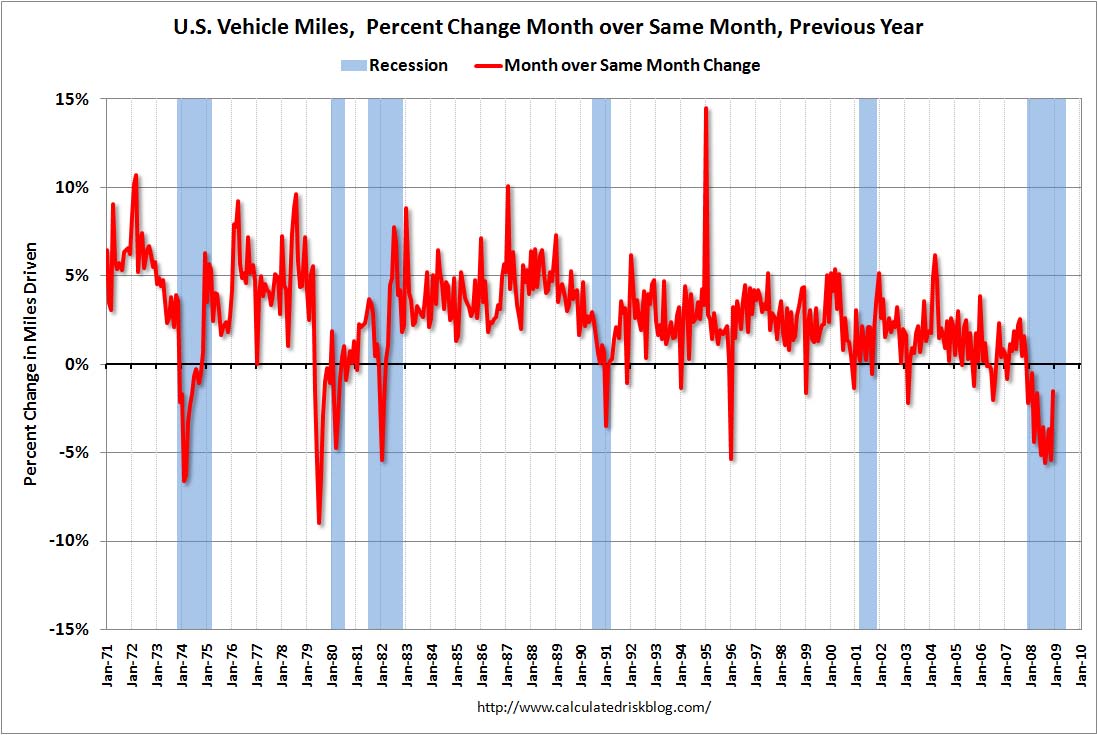
Also check this graph, for general driver behaviour:
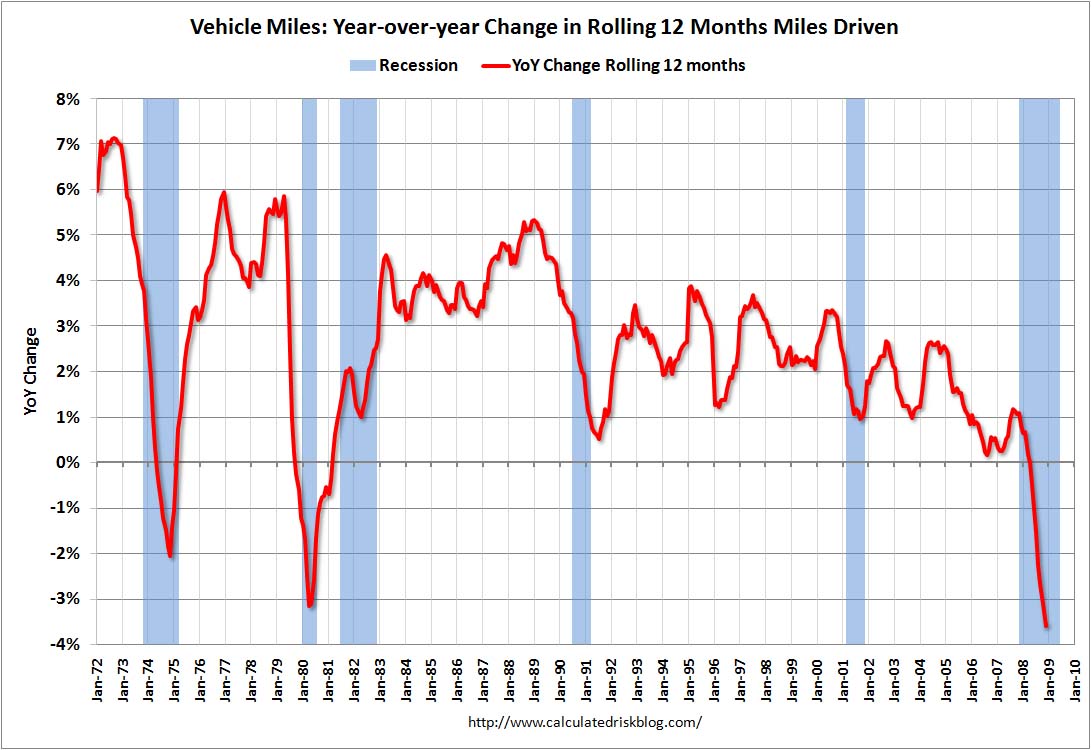
1. The traffic volume is lowest during winter. And due to cold (and recession), people either stay at home more or save more of their income for heating bills.
2. Since 91, this is the first time YoY change is negative.


Data from : http://www.fhwa.dot.gov/ohim/tvtw/tvtpage.cfm
Sources:
http://graphoilogy.blogspot.com/2009/02/vehicle-miles-driven-at-record-low.html
http://www.calculatedriskblog.com/2009/02/us-vehicle-miles-driven-off-36-in-2008.html

Read more...

Chinese Electricity Demand and Recession

11:22 AM Reporter: Baris Sanli 0 Responses
One of the implications of the recession is the big drops in electricity demands. In the developing countries, we see electricity demand drops followed by drops at industrial activity statistics. Here we see a basic example of economic activity(export rate is an indicator of Chinese economy) and electricity demand.

This news (China hit by massive drop in exports) from Financial Times says :
"Chinese exports plunged 25.7 per cent in February compared with a year ago, much higher than analysts had expected, as the global economic crisis began to take its full toll on the country’s export sector."

You should also check the following line:
"China’s exports have decreased for four months in a row, but until February the rate of decline had been much slower than seen in other Asian countries with large export sectors. .... The trade surplus, which has been at record levels for the last four months, also shrank sharply from $39.1bn to $4.84bn."

This reminded me the news from last month about a drop in Chinese electricity demand. Last month(Jan 2008), we have seen a 13% drop in Chinese electricity demand:

"Major power producers generated only 250.3 million megawatt hours of electricity last month, falling 13 percent from a year earlier, the China Daily reported. This is the fourth consecutive month that electricity generation in the country declined".
Source: China Post

Also read this one from Xinhua:

"However, the decline was smaller than in November and December, when power use fell 8.6 percent and 8.93 percent, respectively. According to CEC, the slowing pace of decline was a sign of economic recovery, as industrial use accounts for about 75 percent of total consumption. "

If you check Chinese state grid web site (http://www.sgcc.com.cn/) , you will see that the graphs (English / Statistics) are not updated for a long time

Read more...

Will the peaking of the fossil fuels save the earth?

9:03 PM Reporter: Baris Sanli 0 Responses

Ugo Bardi from The Oil Drum has published a very interesting post today, which worths a look. As you know, suggested by some people fossil fuels may peak/peaked (like oil) and this may lead to a decrease in their consumption and an increase of the fossil fuel prices. The summer turmoil of oil prices is a brief simulation of a what a post-peak oil world may look like. And this may eventually appear as a mitigating factor for climate change.
According to an article published by Willem Nel and Christopher Cooper, CO2 concentration levels do not exceed 550ppm. And temperature increase will not be more than 1C before 2100.
But there are other people who found them very "optimistic" and these articles will be published soon.
I suggest following readings:


Read more...

Free Software for Assesing Greenhouse gas induced Climate Change

8:41 PM Reporter: Baris Sanli 0 Responses
If you are one those experts that do not submit yourself to international climate change groups and have enough knowledge to built your own scenarious, there is tool that can help you.
It is free of charge, just press download in the following site, and submit the form, then you will be directed to a page to download one big chunk of model and files. (Size: 160 MB). The name of the program is Magicc/Scengen. It does all sorts of things. Web page is at the end of this post.
The following information is from the website:

"MAGICC consists of a suite of coupled gas-cycle, climate and ice-melt models integrated into a single software package. The software allows the user to determine changes in greenhouse-gas concentrations, global-mean surface air temperature, and sea level resulting from anthropogenic emissions"


MAGICC/SCENGEN Overview:
MAGICC and SCENGEN are coupled, user-friendly interactive software suites that allow users to investigate future climate change and its uncertainties at both the global-mean and regional levels. MAGICC carries through calculations at the global-mean level using the same upwelling-diffusion, energy-balance climate model that has been and is employed by IPCC. SCENGEN uses these results, together with spatially detailed results from the CMIP3/AR4 archive of AOGCMs, to produce spatially detailed information on future changes in temperature, precipitation and MSLP, changes in their variability, and a range of other statistics.
In running MAGICC/SCENGEN, the user can intervene in the design of the global or regional climate change scenario in the following ways:
By selecting and/or specifying the greenhouse gas and sulfur dioxide emissions scenarios.
By defining the values for a limited set of climate model parameters in MAGICC that are important in determining the effects of uncertainties in the carbon cycle, the magnitude of aerosol forcing, the overall sensitivity of the climate system to external forcing, and ocean mixing rate.
By specifying the future time period for which results are displayed (out to 2400).
By specifying the AOGCMs that are averaged to produce the climate change pattern information.
By selecting an area or region for spatial averaging of climate change results.
This version of MAGICC/SCENGEN was developed primarily with funding from the U.S. Environmental Protection Agency, but it rests on developments carried out over the past 20 years that were funded by a number of organizations.

Download from here:

Read more...

Turkish Electricity and Energy Demand until 2020

1:10 PM Reporter: Baris Sanli 0 Responses
One of the many questions regularly discussed in Turkey is whether the energy demand projections are faulty or there is an "age-old" program that doesn't fit today's world. To challenge this question and to show that results are a product of inputs, I made an approximation to Turkish Energy Ministry's MAED results of 2004. The following excel sheet is a result of my work. What I basically did was to take the published forecasts from the ministry's web site and make the appropiate approximations. By permission, I posted it on several forums. And no one criticized it, and I received emails for how to use the model or methodology!
The main point in this work is as long as you put economic realisations model corrects itself. At the end even some Nobel price winning economists do not owe their success to that software or this software but a bunch of simple equations.
The following forecast assumes 2009 is not a negative growth year.
My forecast for March is as follows (for total energy):

And electricity demand is as follows


Excel file is here, use with permission ( The economic and demographic growth rates are not reflecting the real values)

Read more...

2007 Turkish Electricity Consumption by Sectors

12:50 PM Reporter: Baris Sanli 0 Responses
Turkish electricity consumptions by sectors can be reached from TEDAS website. The latest year is 2007

You can also reach the Excel file that I prepared from this link.

The important thing in this graph is the robust growth in services and industry sectors. Of course, when looking into 2009, we will miss that year dearly. In services sector, especially hotels and tourism may be a bing contributor to this demand. Household consumptions however is more balanced and with a slower than economic growth rate.

Read more...

Will energy consumption rebound aggresively after the recession?

12:13 PM Reporter: Baris Sanli 0 Responses

The happy days are over and we cannot have a good prediction for the end of this recession. Energy demand is highly correlated with economic growth. For developed countries, energy demand growth is less than the economic growth, on the other hand for developing nations it may be more than the economic growth.
So to forecast energy demand, oil prices and new investment cycle, economic forecasts are very important.
Recently econbrowser.com website has a very interesting post to read. It may need some econometric background but the main point is quite clear. Will the rebound from the recession start with a big jump or just average?
Answers vary, and if you read the post and relevant links, there are two explainations:
1. It will be higher than normal : (Trend stationary)
"suppose that the economy is down because people are postponing the purchases of cars and other goods out of fear. That would be a trend-stationary story, because it suggests a nice rebound when people get over their fear."
2 . It will be just around average: (Unit root)
"Suppose that the economy is down because we accumulated the wrong types of physical capital (houses) and human capital (skills in mortgage securitization). That is a unit-root type problem. Yes, the economy will start growing again at some point, but that misallocation of physical and human capital is a permanent loss. We are not going to make up for it with some above-normal growth."

The detailed explanations and models worth reading:

From EconBrowser.com

A simple regression of log GDP on a time trend and lagged log GDP, over the 1967q1-08q4 period yields the following:

yt = 0.424+0.0004time + 0.945yt-1

Where Adj-R2 = 0.9995, SER = 0.008

The AR1 coefficient of 0.945 (se = 0.03) implies a half life of 12.25 quarters, or slightly over 3 years for a deviation from output. Since AR coefficients are biased downward, this is a downwardly biased estimate of the half life.

Brad de Long's Blog


A more technical article about this issue:
Unit root or trend stationary
from Greg Mankiw's Blog

Read more...

Will wind turbines slow earth's rotation?

11:48 AM Reporter: Baris Sanli 0 Responses

It may sound stupid to you, but this is actually true. Too many wind turbines may really slow down earth's rotation, but not to significantly. From Yahoo Answers :

"The effect on the Earth's rotation should be less than any effect on the wind. It wouldn't be significant and it might not even be measurable. Besides global climate change from burning coal to generate electricity will effect the Earth far more than the potential lose or gain of a picosecond in a day caused by wind turbines."

You can also check another discussion at Discovery Community website.
This is the basic problem with generating energy, like Heisenberg's Uncertainity Principle , when you try to use one kind of technology to harness an innocent energy type, you change other things.
But still, the key point is to have the minimal impact!

Read more...